"Compare and contrast the oxygen and carbon dioxide dissociation curves."
Oxygen is transported around the body attached to the protein
haemoglobin. It binds in a reversible reaction to form oxyhaemoglobin (![]() )
)
For this reaction a dissociation curve can be plotted of O2
saturation against ![]()

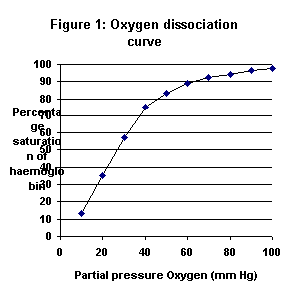
The oxygen dissociation curve that can be plotted by measuring oxygen
absorption compared to ![]() is shown in
figure 1. Also plotted is the amount of oxygen dissolved in the blood. Dissolve oxygen
follows Henry’s law, that is, dissolved oxygen is proportional to the partial
pressure. For each mm Hg of
is shown in
figure 1. Also plotted is the amount of oxygen dissolved in the blood. Dissolve oxygen
follows Henry’s law, that is, dissolved oxygen is proportional to the partial
pressure. For each mm Hg of ![]() 0.003ml O2
is dissolved in each 100 ml blood. This gives about 0.3ml O2/100 ml blood at
physiological
0.003ml O2
is dissolved in each 100 ml blood. This gives about 0.3ml O2/100 ml blood at
physiological ![]() . This is clearly
inadequate for the needs of humans and thus this is where haemoglobin is brought into
play.
. This is clearly
inadequate for the needs of humans and thus this is where haemoglobin is brought into
play.
It can be seen from the curve that haemoglobin has a significant
affinity for oxygen. The curve has a distinctive sigmoidal shape. At low partial pressures
of oxygen the increase in saturation per mmHg![]() increases to quite a high level. At
increases to quite a high level. At ![]() of about 50 mmHg however the curve flattens. At this point only a little more
oxygen can become bound to the haemoglobin. The maximum saturation point of haemoglobin
can be found by increasing the oxygen pressure to a very high value of around 600 mmHg.
of about 50 mmHg however the curve flattens. At this point only a little more
oxygen can become bound to the haemoglobin. The maximum saturation point of haemoglobin
can be found by increasing the oxygen pressure to a very high value of around 600 mmHg.
The shape of the curve is important in determining the characteristics
of oxygen transport. That the curve flattens off means that any change in the ![]() of inhaled gas will have only a little affect
on the concentration of gas absorbed into the blood stream (Although at high altitudes or
similar situation this will not be able to completely compensate for the lost oxygen.) The
amount of oxygen transferred to the blood will thus only be increased by an increase in
blood flow through the alveolar tissue. The flatness of the upper portion of the curve
also means that a strong gradient between the alveolar gas and the blood is maintained
when most of the oxygen has been transferred from the alveolar gas to the blood. This
helps to ensure a maximal rate of diffusion.
of inhaled gas will have only a little affect
on the concentration of gas absorbed into the blood stream (Although at high altitudes or
similar situation this will not be able to completely compensate for the lost oxygen.) The
amount of oxygen transferred to the blood will thus only be increased by an increase in
blood flow through the alveolar tissue. The flatness of the upper portion of the curve
also means that a strong gradient between the alveolar gas and the blood is maintained
when most of the oxygen has been transferred from the alveolar gas to the blood. This
helps to ensure a maximal rate of diffusion.
The steep lower part of the oxygen dissociation curve means that
peripheral tissues are able to extract large amounts of oxygen from the blood for only a
small drop in ![]() across the capillary wall.
High
across the capillary wall.
High![]() on the tissue side of the capllary
wall will mean a faster diffusion of gas through the tissue and maximise the oxygen
delvery to the tissues.
on the tissue side of the capllary
wall will mean a faster diffusion of gas through the tissue and maximise the oxygen
delvery to the tissues.
Unlike oxygen, carbon dioxide is transported in the blood in three forms - dissolved, as bicarbonate or as carbamino compounds in combination with proteins. Dissolved CO2 obeys Henry’s law as oxygen does but is about 20 times more soluble than oxygen. Thus carriage of dissolved CO2 is significant with about 10% carried in this form.
Two reactions are important in the carrying of carbon dioxide as carbonate.
The first is a sequence of reactions:
![]()
In the plasma the first of these reactions occurs quite slowly, but in
the red blood cells there exists the enzyme carbonic anhydrase, which accomplishes the job
much faster. The second step of dissociation is very rapid without the help of an enzyme.
If the concentration of![]() in the cell rises
these ions can easily diffuse away. However the membrane is relatively impermeable to the
in the cell rises
these ions can easily diffuse away. However the membrane is relatively impermeable to the ![]() ions and these cluster in the red blood cells
lowering the pH slightly. Some of the
ions and these cluster in the red blood cells
lowering the pH slightly. Some of the ![]() ions in the cell become bound to the haemoglobin.
ions in the cell become bound to the haemoglobin.
![]()
The "mopping up" effect of this helps to drive the
bicarbonate reaction forward. Hence the presence of reduced haemoglobin, as in the
peripheral tissues, helps with the loading of ![]() into the blood stream. Compare this with the presence of oxygenated
haemoglobin in the pulmonary circulation which assists with the unloading of carbon
dioxide into the alveolar gas. This is known as the Haldane effect.
into the blood stream. Compare this with the presence of oxygenated
haemoglobin in the pulmonary circulation which assists with the unloading of carbon
dioxide into the alveolar gas. This is known as the Haldane effect.
The carbamino compounds are formed by the combination of ![]() with the terminal amine groups of proteins
such as haemoglobin.
with the terminal amine groups of proteins
such as haemoglobin.
![]()
Again more ![]() is bound
as carbamino groups to reduced haemoglobin than to
is bound
as carbamino groups to reduced haemoglobin than to ![]() , contributing to the Haldane effect.
, contributing to the Haldane effect.
The oxygen dissociation curve is also affected by the changes in ![]() although this has more to do with the effects
of
although this has more to do with the effects
of ![]() on
on ![]() concentration. An increase in
concentration. An increase in ![]() shifts the curve to the right meaning that more oxygen is unloaded at higher
partial pressures. A significant part of this will be the strain placed on the hydrogen
bonds stabilising the haemoglobin structure by the change in pH. This is known is the Bohr
effect.
shifts the curve to the right meaning that more oxygen is unloaded at higher
partial pressures. A significant part of this will be the strain placed on the hydrogen
bonds stabilising the haemoglobin structure by the change in pH. This is known is the Bohr
effect.

Now that we have considered the mechanisms of transport of ![]() we can better consider the dissociation curve
that these generate. Figure 2 shows the curve and also highlights the differences between
we can better consider the dissociation curve
that these generate. Figure 2 shows the curve and also highlights the differences between ![]() concentrations at different O2
saturations. Figure 3 is a comparison of typical
concentrations at different O2
saturations. Figure 3 is a comparison of typical ![]() and
and ![]() dissociation curves
plotted on the same scales.
dissociation curves
plotted on the same scales.
As can be seen the carbon dioxide curve is very much steeper than that
of oxygen. In the range 40-50 mm Hg the ![]() concentration changes by about 4.7 ml/100ml blood compared to about 1.7 ml/100ml
difference in oxygen concentration.
concentration changes by about 4.7 ml/100ml blood compared to about 1.7 ml/100ml
difference in oxygen concentration.

While the CO2 dissociation curve is primarily affected by
changes in pH there are many other factors that change the dissociation curve of oxygen. ![]() has already been mentioned. Temperature and
concentration of 2,3-diphosphoglycerate are both able to shift the oxygen dissociation
curve to the right as is an increase in
has already been mentioned. Temperature and
concentration of 2,3-diphosphoglycerate are both able to shift the oxygen dissociation
curve to the right as is an increase in ![]() concentration
as was mentioned earlier. In the body these events will be found in exercising muscle,
which is acid, hypercarbic and hot. Thus oxygen is more efficiently unloading from the
haemoglobin in these circumstances.
concentration
as was mentioned earlier. In the body these events will be found in exercising muscle,
which is acid, hypercarbic and hot. Thus oxygen is more efficiently unloading from the
haemoglobin in these circumstances.
2,3-DPG is the end product of red cell metabolism. An increase in this material occurs when the red cells are in chronic hypoxia. For example, at high altitude the red cells make more 2,3-DPG. The right shift of the dissociation curve means that oxygen, which is now scarce, can be more efficiently unloaded from the red blood cells into the surrounding tissues.
There are important differnences between the carbon dioxide and oxygen
dissociation curves. The carbon dioxide curve is essentially straight at physiological
values of ![]() . Therefore its loading and
unloading are both controlled by similar differences in
. Therefore its loading and
unloading are both controlled by similar differences in ![]() across both pulmonary and tissue capillaries (although of course
the partial pressure differences will be in opposite directions). A large proportion of
hte rate of absorption of CO2 is controlled by the rate of its reactions, both
to form carbonic acid and to form carbamino compounds. These rates will both increase
almost linearly with changes in
across both pulmonary and tissue capillaries (although of course
the partial pressure differences will be in opposite directions). A large proportion of
hte rate of absorption of CO2 is controlled by the rate of its reactions, both
to form carbonic acid and to form carbamino compounds. These rates will both increase
almost linearly with changes in ![]() .The
oxygen curve has a steep section and a flatter one. The flatter one is utilised in loading
the hemoglobin whereas the steep section is utilised in unloading. Both of these sections
in the oxygen curve allow rapid diffusion of oxygen through maintenance of large partial
pressure differences. This is important to oxygen tranpost as this must rapidly be applied
to the tissues. The reason for the difference between the oxygen and carbon dioxide
dissociation curves is due to cooperative binding of oxygen to haemoglobin.
.The
oxygen curve has a steep section and a flatter one. The flatter one is utilised in loading
the hemoglobin whereas the steep section is utilised in unloading. Both of these sections
in the oxygen curve allow rapid diffusion of oxygen through maintenance of large partial
pressure differences. This is important to oxygen tranpost as this must rapidly be applied
to the tissues. The reason for the difference between the oxygen and carbon dioxide
dissociation curves is due to cooperative binding of oxygen to haemoglobin.
Haemoglobin is a tetramer of 2 a and 2 b subunits, each of which can bind to one oxygen molecule. Binding of
oxygen to each subunit increases the affinity for oxygen of the rest. Thus as the ![]() increases the amount of bound oxygen increases
and the amount of oxygen bound per unit rise in
increases the amount of bound oxygen increases
and the amount of oxygen bound per unit rise in ![]() also increases. Eventually virtually all the haem is bound to oxygen and thus
there can be little further increase in oxygen concentration in the blood. (A small
increase will continue to occur as the oxygen actually dissolved in the blood will rise.).
also increases. Eventually virtually all the haem is bound to oxygen and thus
there can be little further increase in oxygen concentration in the blood. (A small
increase will continue to occur as the oxygen actually dissolved in the blood will rise.).
Importantly oxygen is able to be loaded into the blood in far lower quantities than carbon dioxide. Mechanisms could probably be found in nature that would allow a far higher loading of blood with oxygen. The compromise made with haemoglobin is that oxygen must also be readily dissociated in the short space of time the blood is passing through the capillaries in tissues. For carbon dioxide it is essential to clear the CO2 away from the tissue quickly. Especially in cases of hard exercise when a fall in pH can impair muscle function. Once the carbon dioxide is in the blood there are a number of buffering mechanisms to control it’s actions until it can be cleared by the lungs.
The carbon dioxide and oxygen dissociation curves are very different from one another. They share in common a flattening out at higher partial pressures; the oxygen dissociation curve sharply flattening out in response to saturation of haemoglobin, the carbon dioxide curve as a gradual lessening in the gradient of the curve due to shifting equilibrium positions. They are also both affected by the concentration in the blood of each other. They differ in response to the different uses of each. Oxygen must be rapidly transported to and unloaded into cells in peripheral tissues for use in metabolism. Carbon dioxide is a waste product and as such must be rapidly transported away from the tissues. However carbon dioxide has a secondary role in controlling blood pH and for this it’s dissociation curve is modified.
(c)1998 Nick Manville