Parametric Analysis
Parametric analysis was used to determine the influence of a specific variable on the failure rate. One parameter was varied at a time, while the rest were held constant. Probability of failure was recalculated based on the changes in the specific parameter and the results were recorded.
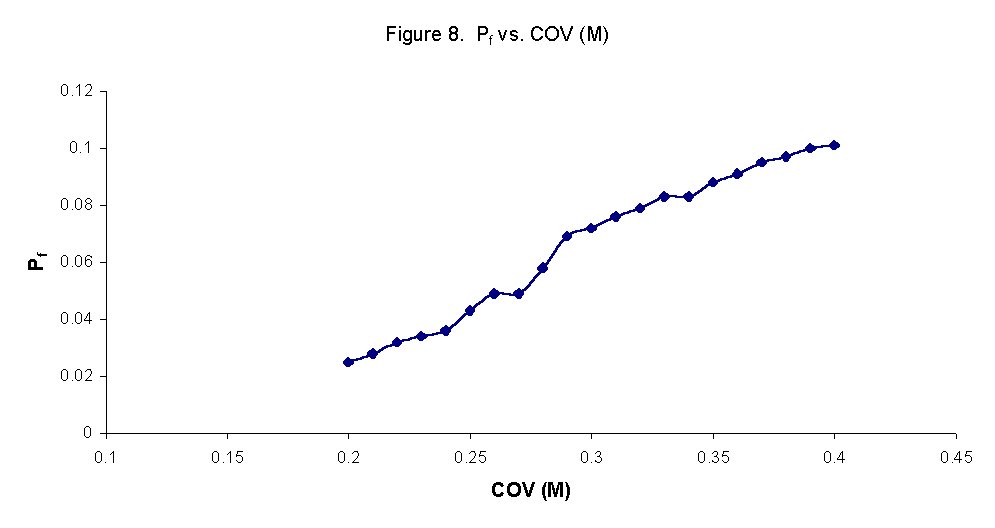
Figure 8 shows the effect of varying the coefficient of variation of M, COV(M), on probability of failure, Pf. It can be seen that as the coefficient of variation of M increases, the probability of failure increases linearly.
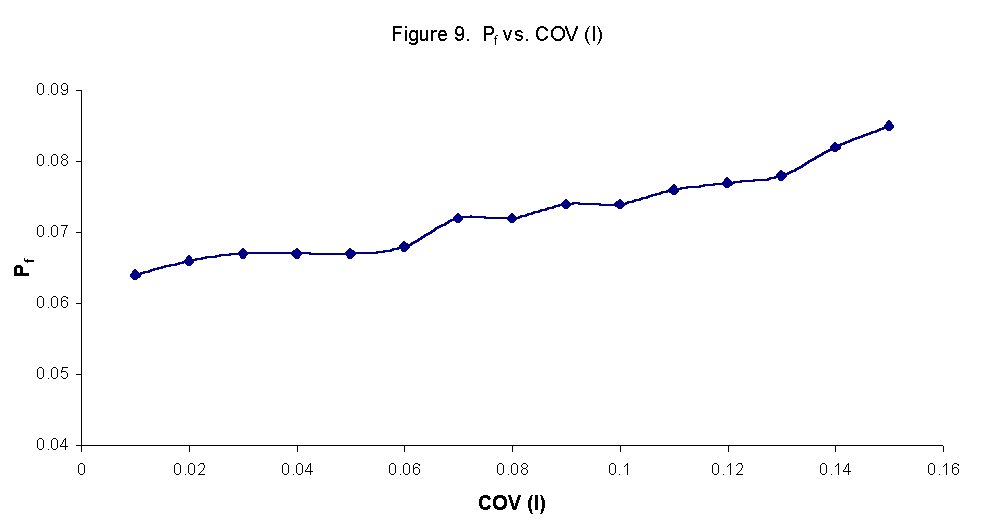
Figure 9 shows the effect of varying the coefficient of variation of I or COV(I), on probability of failure, Pf. It is clear that there is a linear relationship between the two variables and that Pf increases as COV(I) increases.
Figure 10 shows the effect of varying the coefficient of variation of c or COV(c), on probability of failure, Pf. When varying the coefficient of variation for c, COV(c), we observe a positive, almost linear relationship.