Table 1 Number of cattle and sheep lost to wolves, and cattle and sheep available in wolf range in northern Minnesota, 1979-1991(a).......(copied from EIS Table4-2)
|
|
Cattle |
|
|
|
|
Sheep |
|
|
|
|
Killed |
Or Injured |
|
|
|
|
|
|
|
Year |
Adults |
Calves |
Available(b) |
Killed/1,000 Available |
|
Killed or Injured(c) |
Available |
Killed/1,000 Available |
|
1979 |
5 |
12 |
220,970 |
0.08 |
|
1 |
30,839 |
0.03 |
|
1980 |
4 |
12 |
225,244 |
0.07 |
|
56 |
32,950 |
1.70 |
|
1981 |
6 |
24 |
241,291 |
0.12 |
|
110 |
39,569 |
2.78 |
|
1982(d) |
1 |
23 |
241,724 |
0.10 |
|
12 |
34,698 |
0.35 |
|
1983 |
3 |
32 |
242,156 |
0.15 |
|
29 |
29,827 |
0.97 |
|
1984 |
2 |
8 |
242,589 |
0.04 |
|
92 |
24,956 |
3.69 |
|
1985 |
4 |
19 |
243,021 |
0.10 |
|
75 |
20,085 |
3.73 |
|
1986 |
7 |
19 |
220,141 |
0.12 |
|
13 |
15,904 |
0.82 |
|
1987 |
5 |
19 |
220,141 |
0.11 |
|
9 |
15,904 |
0.57 |
|
1988 |
3 |
28 |
220,141 |
0.14 |
|
68 |
15,904 |
4.28 |
|
1989 |
9 |
31 |
220,141 |
0.18 |
|
47 |
15,904 |
2.96 |
|
1990 |
2 |
35 |
220,141 |
0.17 |
|
112 |
15,904 |
7.04 |
|
1991 |
5 |
30 |
220,141 |
.016 |
|
31 |
15,904 |
1.95 |
|
Mean |
4 |
23 |
229,065 |
0.12 |
|
50 |
23,719 |
2.11 |
(a) Losses are verified wolf caused kills and maulings, and include verified "probable" wolf losses. Data are from S.H. Fritts (unpubl. Data), and W.J. Paul (1991) unpubl. Annual prog. Report. Adapted from Mack et al. 1992b.
(b) Available livestock are based on Minnesota agricultural statistics for 1979, 1980, 1981, 1985, and 1986 (S.H. Fritts unpubl. Data).
(c) Includes only total sheep. Lambs and adult sheep lost to wolves were not tabulated in the available datasets.
(d) Interpolation was used between 198and 1985 to estimate cattle and sheep availability.
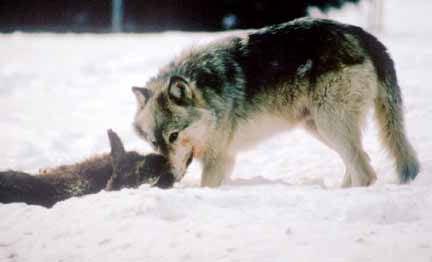
Figure 2 Wolf feeding on Ungulate
![]()