Medical Imaging and Visualization
What's volume visualization
The visualization of volumetric data has aided many scientific disciplines
ranging from geophysics to the biomedical sciences. It reveal interal structures
of 3D objects and allows users to peer inside of complex scenes.
Volume visualization is a fast growing field that develops from computer
graphics, computer vision, and image processing. Volume Graphics,
a new discipline, has formed that studies the representation, manipulation,
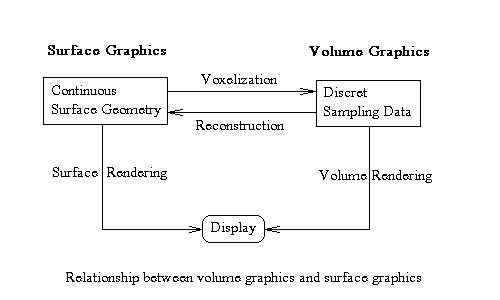
and rendering of volume data. The relationship between volume graphics
and traditional computer graphics (also called surface
graphics) can be depicted in the following diagram.
 Among a wide range applications, one of the most successful applications
of volume visualization is in medical diagnosis and surgery planning where
anatomic structures are reconstructed, rendered, and analyzed in order
to produce informative rendered images, identify tumors, implement quantitative
measurements, simulate operations in virtual operating rooms and so on.
Projects
-
“Non-destructive Anatomy Education System for Medical Colleges”
with the First Hospital of Harbin Medical University, funded by the
State Education Committee of China.
This project continued the work done in NLPR. The main tasks include
transporting the system from SGI workstation to PC platform. The GL graphics
library used in the original system was replace by OpenGL. Besides, much
effort has been put on segmentation and labeling of a volume data set (Human
head). We designed an interactive means for physician to use in labeling
tissues and organs and associating with correspondent medical terms. In
order to make the system be a useful education tool for anatomy the system
provides a set of manipations, navigation, and stereo rendering.
-
Sino-France Joint Project “Volume Visualization of Medical images
”,
funded by INRIA and the Chinese Academy of Sciences.
The scope of the research includes volume visualization techniques,
medical image analysis, multi-modality image fusion. I was in charge of
the research and development of volume visualization
as described as follows.
My visualization system
Volume Visualizer is a volume visualization system that unites
numerous visualization methods within a comprehensive visualization system,
providing a flexible tool for the scientist and engineer. It is composed
of a library which serves as building blocks for visualization developer
and researcher. The system was developed by Dr. Guan and his colleagues
in the National Laboratory of Pattern Recognition of China, which was written
in C and GL library, run on SGi workstation. The system is to be updated
and re-coded in C++, Motif and OpenGL. The current system has following
modules:
-
Segmentation of 3D volume data
-
Re-slicing
-
3D image registration and multi-modality data fusion
-
Voxel-based iso-surface reconstruction
-
3D surface from planar contours
-
Direct volume rendering
-
Direct iso-surface rendering
-
Manipulation and navigation
-
Quantitative measurements
-
Tumer identification
Image Gallery

|
|
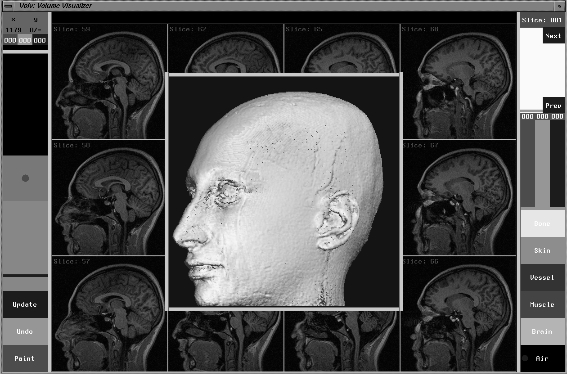
User interface of Volume Visualizer
|
|
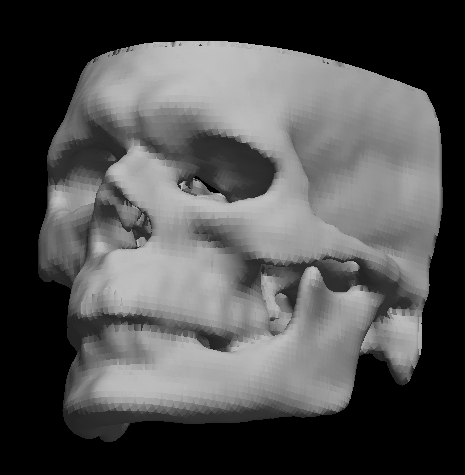
Iso-surfaces of human skull (Generated from 64*64*64 CT data)
|

|
|
Large rendered image (Generated from 64*64*64 CT data)
|
|
Direct volume rendering (Generated from 128*256*256 MRI data)
|


