Emulsions are classified in a spectrum ranging from stable (or permanent) to unstable (temporary). A stable emulsion is characterised by very finely-divided droplets of the dispersed phase in the continuous phase. The droplets are of the order of 1.5µ (1.5 micron). Such emulsions take extremely long times to break up into the constituent oil and water, if they ever break up. In unstable emulsions, droplets of the dispersed phase are of the order of 10µ. Such emulsions break up within a reasonable period of time.
The more mixing energy is applied to a water/oil mixture, the tighter the resulting emulsion, since the energy serves to break up the dispersed phase into finer droplets.
The behaviour of oil/water mixtures in crude oil pipelines cannot be predicted by purely analytical means. The oil and water interact across their interface. The extent of this interaction determines the effective properties of the mixture. The most affected property is viscosity. This happens to also be perhaps the most important property in determination of pipeline friction pressure loss and hence, optimum pipeline diameter for transportation of a given volume rate of wet crude oil. Its value depends on the assumed interaction between the two sub-phases. In an oil/water mixture, one sub-phase is considered the dispersed phase , broken up into droplets which are dispersed in the other sub-phase, the continuous phase. The extent of interaction between the dispersed phase and the continuous phase depends on the mixing energy that has been applied. The mixing energy is initially applied at the pipeline inlet with a pump. The applied energy shows up in form of pressure head at the pump discharge (which is at the pipeline inlet). As the liquid flows in the pipe, this energy is progressively dissipated to various causes, the most significant of which are friction, elevation changes and, to a lesser extent, acceleration.
Stable emulsions are undesirable in the oil-field, not only because they increase pipeline pressure losses, but for the additional process equipment they require. Where tight emulsions are encountered, special emulsion heater-treaters with separators must be installed at the dehydration centre. Many surface facilities for oil production incorporate demulsifier skids at gathering stations. Demulsifying chemicals are injected to facilitate break-up of the emulsion for easy gravity separation at the dehydration centre.
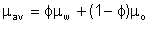
Perhaps the most simplistic approach to estimation of emulsion viscosity is to assume it to be made up of the viscosities of the parent oil and water in the ratio of their volumes. By this, an emulsion derived from oil of viscosity 10 centipoise, with 30% water would have a viscosity of 7.3 cp. This is of course far from reality because, while there may be uncertainties regarding the actual emulsion viscosity, it is universal practical experience that the viscosity of a water-in-oil emulsion is higher than that of the parent oil, up to a point. The flaw in the weighted-mean approach is that it assumes that there is no inter-facial interaction between the dispersed and the continuous phases.
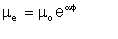
William Woelflin found out that if, starting with dry oil, we produce emulsions by incremental addition of water and mechanical mixing, the viscosity of the resulting emulsion increases exponentially with the water-cut, up to a point where the viscosity drops sharply to a value close to that of the parent water. The point at which the viscosity drops sharply is the inversion point, marking the inversion of the emulsion from being water-in-oil to oil-in-water. The general representation of the exponential behaviour (i.e. up to the inversion point) is of the form of Arrhenius equation:
|
| Eqn 2/1 |
where µe is the emulsion viscosity, µo is the viscosity of the dry oil, µ is the water-cut as a fraction, and µ is a constant (described by this author as the emulsion viscosity constant) dependent on the oil, but generally in the range 3 to 6. A higher value of µ indicates a tighter emulsion. For example, an emulsion produced from dry oil of viscosity 10 centipoise, 35% water (i.e. µ = 0.35), with an emulsion viscosity index of 4.0 is estimated to have a viscosity of 35 centipoise.
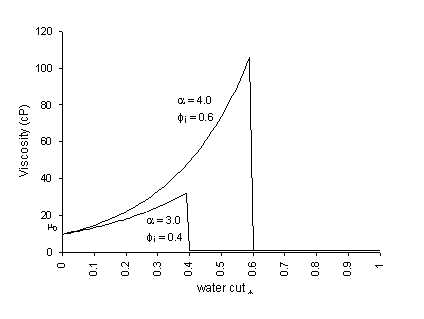
Fig. 2-1 Woelflin's correlation for emulsions
This author, in addition to confirming Woelflin's equation by tests, also
established that, for the same addition of mixing energy, the inversion point also
varies with the oil, in the range 0.35 to 0.7.
Many computer software for
pipeline hydraulics calculation normally assume Woelflin's correlation for wet oil
viscosity up to an inversion point which is usually assumed to be the same
(typically 0.6) for all oils. The weakness of this approach lies in the
following:
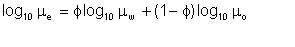
Another approach to estimation of emulsion viscosity is to assume a logarithmic relationship between the emulsion viscosity, and those of the parent oil and water. By this method, our oil viscosity 10 centipoise, emulsified with 30% water, would produce an emulsion viscosity given by:
| Eqn 2/2 |
An immediate flaw in this method is that, by definition, pure water has a viscosity of 1 cp, meaning that, with an emulsion made up of oil and pure water, regardless of the water-cut, emulsion viscosity is always less than that of the parent oil. This is of course not true.
Taylor proposed a semi-theoretical equation for calculation of the viscosities of immiscible liquid mixtures:
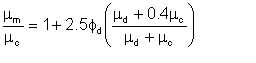
| Eqn 2/3 |
where subscripts c and d denote the continuous and dispersed phases respectively. The equation is based on the existence of small spherical droplets and probably does not apply for φd greater than about 0.03.
Surface tension arises from forces between the molecules of a liquid and the forces between the molecules and those of any adjacent substance. These forces are generally unequal and, as a result, there is a resultant force which opposes any increase in the area of a liquid surface. Such an increase in surface area requires expenditure of energy, and the existence of a free surface (such as the contact between water in a glass, and the free air) implies the presence of free surface energy, which equals the work done when the surface was formed.
Because a system tends to move towards a condition of stable equilibrium in which its potential energy is a minimum, a quantity of liquid will adjust its shape until its surface area, and therefore its free surface energy, is a minimum. Thus, a drop of liquid, free from all other forces, assumes a spherical shape since this gives the minimum surface area for a given volume.
Free surface energy implies the existence of a tensile force in the surface. A surface requires mechanical energy for its formation, and if it contracts it loses mechanical energy, that is, it does mechanical work. Hence, it exerts on its surroundings a force in the direction in which it moves when contracting. In other words, the surface is in a state of tension.
If a line is imagined drawn in the surface, then the liquid on one side of the line pulls that on the other side. The magnitude of surface tension is defined as that of the tensile force acting across and perpendicular to a short, straight element of the line, divided by the length of that line segment. This explains why surface tension has the dimension of force per unit length, i.e. [M L T-2]/[L] = [M T-2].
However, it can also be shown (by elementary physics principles) that the surface tension thus defined is equivalent to the free surface energy per unit area. The free surface energy is the mechanical work done per unit increase of area, and this is the surface tension.
Water in contact with air has a surface tension of about 0.073 N/m at usual temperatures. Most organic liquids have values between 0.02 and 0.03 N/m and mercury about 0.48 N/m, the liquid in each case being in contact with air. For all liquids the surface tension decreases as the temperature rises.
That tension which exists in the surface separating two immiscible liquids is known as interfacial tension.
Consider a spherical droplet of diameter dp1. This droplet has surface area πdp12 and volume πdp13/6. Let the volumetric flow rate of the dispersed phase be Qdisp. The number of droplets of the dispersed phase is given by
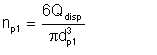
| Eqn 2/4 |
The total surface area of the droplets is given by
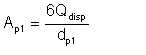
| Eqn 2/5 |
If by expending energy the droplets are broken up into smaller droplets of average diameter dp2, the new number of droplets is given by:
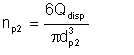
| Eqn 2/6 |
and the total surface area is given by
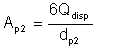
| Eqn 2/7 |
Thus, the change in surface area resulting from applying energy is
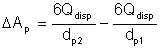
| Eqn 2/8 |
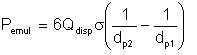
From our discussion of interfacial tension, the product of this increase in surface area and the interfacial tension should equal the expended energy, assuming that all the energy actually went into breaking up of the liquid. Mathematically,
| Eqn 2/9 |
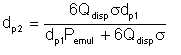
Thus,
| Eqn 2/10 |
The energy dissipated in increasing the total surface area of the dispersed phase droplets is only part of the total energy dissipated in shearing the entire liquid, since the dissipation makes no distinction between the phases. Therefore if the total energy dissipated in shearing is Pshear, the portion that goes into creating the dispersed phase droplets will be proportional to the mass ratio of the phases. Thus, we can write:
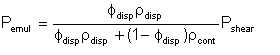
| Eqn 2/11 |
We emphasize that the average droplet size dp is no more than an average size. In practice, the droplet size distribution can be modelled to follow the beta probability distribution. The beta probability density function is given by
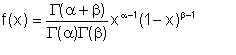 for (x < 0 <1)
elsewhere
Eqn 2/12
where α and β are positive constants that determine the specific shape of the curve. The value of a determines how steeply the curve rises while ’ determines how quickly it falls after the maximum point. When α = β, the curve is symmetrical about the line x = 0.5. Typical beta distribution curves are shown in figure 2.2.
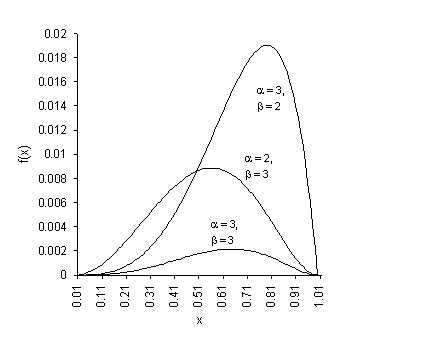
Fig. 2-2 Beta probability distribution
The symbol Γ(α) is defined by
| Eqn 2/13 |
Note that for a positive α,
| Eqn 2/14 |
whence
Γ(1)=1, Γ(2)=1,Γ(3)=2,Γ(4)=6, etc. ; Γ(1/2)=√π
The expected value (i.e. mean value) of the distribution is given by
| Eqn 2/15 |
and the variance by
| Eqn 2/16 |
It can be shown that f(x) maximises at a value of x given by
| Eqn 2/17 |
What we statistically refer to as expected value E(X) is in fact the average droplet size dp. The proportion of the droplets that are of diameter greater than a certain value dp is given by
| Eqn 2/18 |
It can be shown that
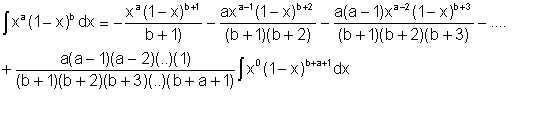
| Eqn 2/19 |
It can be shown that

| Eqn 2/20 |
The following is an acceptable approximation to this expression when x<1 :
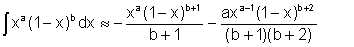
| Eqn 2/21 |
Sleicher suggested that dp ranges between dp,max/4 (for low flow velocities) and dp,max/13 (for high flow velocities). If we take the practical range of liquid velocities as being from 0 to 5 m/s, we can propose a linear interpolation for dp in terms of the maximum droplet diameter and the flow velocity:
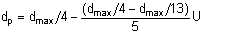
| Eqn 2/22 |
By intuition, we can propose that α = 3. With this, the value of β varies from 9 to 36. We can thus recast equation 2/22 in terms of α as follows:
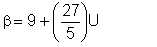
| Eqn 2/23 |
whereβ is rounded up to the nearest integer.
We will illustrate application of these equations with an example.
Wet crude oil, with an average water droplet size of 150μ flows in a pipe, with an average velocity 2 m/s. If we process the emulsion such that all water droplets larger than 50μ; are removed, what proportion of the original water remains in the oil ?
We have assumed that α = 3
Equation 2/23 gives β = 9 + (27/5) x 2 ≈ 20
Integral equation 2/21 evaluated between the appropriate limits gives
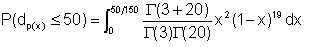
| Eqn 2/23a |
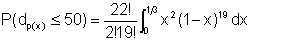
| Eqn 2/23b |
This leads to
P(dp(x)<50) = 4620(2.00 x 10⁻⁶) = 0.009
This means that 0.9% of the water droplets remain in the oil.
This example we have just seen is important in consideration of the separator effect of a pipeline.
This author proposes that, for any improvement on current methods of predicting emulsion viscosity, a new concept is required. We must define some new quantity which indicates the extent of emulsification of an oil/water mixture. This quantity will be called emulsification index.
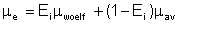
Looking at existing methods, we identify two extremes of possibilities. Woelflin's correlation represents one extreme in which there is total emulsification, giving very high emulsion viscosities up to the inversion point. The weighted-average method is the other extreme which assumes no interfacial interaction between the dispersed and the continuous phases, that is, there is total absence of emulsification. In practice, the truth is somewhere in between. A formal definition of emulsification index would be as follows:
Emulsification index (Ei) is the extent to which the viscosity of a water-in-oil emulsion is determined by Woelflin's exponential correlation.
Emulsification index will conventionally be taken as ranging from 0 to 1. For a fully emulsified mixture, Ei = 1. Total absence of emulsification means Ei = 0. This is equivalent to the weighted-mean assumption. Viscosity of an emulsion is then calculated as comprising partly of the value given by Woelflin, and partly by the weighted average. Mathematically,
| Eqn 2/24 |

| Eqn 2/25 |

| Eqn 2/26 |
| Eqn 2/27 |
A comparison of the emulsion viscosities given by the three methods described is shown in figure 2-3.

Fig. 2-3 Emulsion viscosity correlations
Since emulsification is about break-up of the dispersed phase into smaller droplets within the continuous phase, there is necessarily a relationship between emulsification index, and the average droplet diameter. At this point, we must define what sort of droplet sizes correspond to a given emulsification index. This also compels us to think of degrees of emulsification, rather than whether or not there is emulsification. In mathematical terms, emulsification is a continuous function.
This author proposes that an average droplet size of 1000* (i.e. 1mm) or larger be taken as total absence of emulsification, and that emulsification index relates logarithmically to droplet diameter. Mathematically,
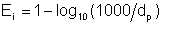
| Eqn 2/28 |
where dp is in micron units (10-6 m), provided that if dp < 1.0, Ei = 1.0 and if dp > 1000, Ei = 0.0.
This equation simplifies to
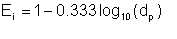
| Eqn 2/29 |
The equation gives emulsification indices for typical droplet diameters as follows:
| dp(micron) | Ei |
| 1.0 | 1.0 |
| 1.5 | 0.94 |
| 10 | 0.67 |
| 100 | 0.34 |
| 1000 | 0 |
From this, we can see immediately that an emulsification index greater than 0.9 indicates a really tight emulsion.