Advanced Research and Therapeutic Institute ENCEPHALOS
3 Rizariou Street, Halandri 15233, GREECE
In Vivo Proton MR Spectroscopy of Brain Lesions
By E.D. Gotsis, Ph.D.
This page is constantly under
construction!
They say a picture is worth a thousand words, so here are a few pictures worth a few thousand words?
All comments will be made after browsing this gallery of spectra.
The story must start with a couple of spectra from a normal brain, acquired from the same patient at the same anatomical location (the left occipital lobe), but with two "different" pulse sequences: one provided by the manufacturer (Siemens, Erlangen, Germany) with slice-selective gradients of 2.0 mT/m and the modified version of this sequence by yours truely, at 3.35 mT/m and subsequent reoptimisation. The original purpose of the modification was to allow for smaller voxel sizes (down to 12x12x12 mm from the 20x20x20 mm allowed by the manufacturer's sequence) but it turned out that the stronger gradient pulses resulted in sharper slice profiles and "cleaner" spectra, as the two spectra below show. They are acquired with (no other choice in order to compare the two sequences) 20x20x20 mm voxels.
For comparison let us also look at the spectrum of a normal muscle:
Comparing the first two spectra, it is obvious that the stronger gradient pulses suppress signal "contamination" from skull lipids in the 0.8-1.6 ppm region. It is not obvious but it should be kept in mind that the "other" side of the filtered sinc rf pulses used for excitation represents normal brain outside the chosen voxel, therefore we have every reason to believe that contributions from normal brain outside the chosen voxel is also minimised with the stronger gradient pules used in our modified sequence. For the non-initiated reader of this page let us simply describe the major peaks shown in the above spectra:
Choline containing compounds at 3.2 ppm
Creatine/phosphocreatine (tCr) detected at 3.0 ppm
N-Acetyl Aspartate (NAA) detected at 2.0 ppm
In the spectra that follow you might also see lactate with an inverted peak (because of the TE chosen to be 1/split frequency of the lactate doublet) at 1.32 ppm, lipids at 1.25 ppm (methylene chains overlapping with lactate) and at 0.9 ppm (methyl groups), myo-inositol at 3.56 ppm, and some peak seen at 2.04-2.06 ppm.
Let us now examine spectra acquired from various brain lesions.
 |
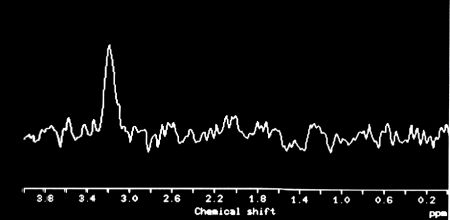
Figure 6. In Vivo Proton MR spectrun of the above patient's chordoma. Choline is the only detectable substance. |
What is common in the above spectra? High choline concentration in the malignant tumors but near "normal" in the benign tumors,
undetectable creatine/phosphocreatine (tCr)
and no NAA. All
lesions are non-infiltrating (non-diffuse) tumors. No metabolites
are detected in lesions with no viable cells (hemorrhagic
lesions, cavernomas).
Let us proceed now with another
category of tumors: infiltrating (or invasive) tumors, i.e.,
gliomas.
Technical Details
A PRESS sequence with TR/TE=1600/135 msec, voxel dimensions from
13x13x13 mm up to 15x15x15 mm and 256 acquisitions (acquisition time 7 min) were used. Spectral resolution was
routinely 1-3 Hz and at times as
good as 0.8 Hz! I can send the
original FID to any Doubting Thomas (in *.DAT or *.IMA format) to
see for themselves!
What do we see in this second category of spectra?
1. Choline is always detected.
2. tCr (total creatines, i.e., creatine and phosphocreatine) are detectable even in the most malignant tumors, the glioblastoma multiforme. It should be noted here that if smaller voxels could be used (as we have done in some CSI cases) areas with no detectable creatines can also be found in glioblastomas multiforme. Therefore some averaging of inhomogeneous areas within the tumor is taking place. The choline/tCr ratio increases with malignancy (choline is increasing and at the same time tCr is decreasing).
3. NAA is undetectable or in small
concentrations, even in most low grade astrocytomas.
What is different between the gliomas (and gliomatosis cerebri of course) and the other brain tumors (whether benign or malignant)? The gliomas are infiltrating (diffuse) tumors and coexist with brain neurones.
Many conclusions can be drawn from these findings but these (in addition to many more spectra) are the subject of a paper that is being submitted for publication.
What our laboratory can state with certainty is that for the past year (following an exhaustive five-year clinical trial) we have been applying the technique to selected patients at the clinical level. We do not claim that "In Vivo Proton MR Spectroscopy" is a substitute for biopsy but in many cases it comes quite close to being one.
Conclusions: Provided that the spectra originate exclusively from the examined lesions (i.e., absolutely no partial volume averaging occurs during spectral acquisition, otherwise the "all-or-none" tCr and NAA effect is useless for the distinction) the method can answer several diagnostic questions:
1. Neoplasia vs. non-neoplasia (e.g., low grade glioma or gliomatosis cerebri vs. an ischemic infarct or inflammatory disease, eg., AIDS leukoencephalopathy). At times a large MS placque might give a spectrum similar to a low grade glioma or gliomatosis cerebri, so one should not neglect imaging imformation.
2. Infiltrating vs. non-infiltrating tumors.
3. Malignant vs. benign tumors (with less than 100% accuracy).
4. Radiation necrosis vs. recurrent tumor (no choline in radiation necrosis).
Assuming that the tCr detected in gliomas (we will cite many arguments for this) originates in neurones coexisting with cancer cells in what appears as the "tumor" in MRI, no tCr are detectable in cancer cells, whereas tCr are detectable in all healthy cells (brain, muscle, prostate, and other body organs). What is the meaning of this remains to be seen. Does it relate to the cell metabolic pathways? How different the metabolic pathways of tumor cells are form those of healthy cells? How are the spectroscopic results related to the metabolic pathways of normal body and tumor cells? Is the increase of choline concentration a result of more tumors cells/unit volume or is more choline/tumor cell compared to normal cells?
It is our opinion (backed up partially by the pathology results) that the choline concentration is related to cell density (malignant tumors are more cell-packed) rather than more choline per cancer cell. We have no hard proof for this and we would be delighted if other laboratories could prove or disprove the above consideration.
Assuming that the choline concentration per cancer cell is similar to benign and malignant tumors alike, and also assuming that the creatines detected in gliomas do not originate in tumor cells but in neurones coexisting with tumor cells, then it is possible that tumor metabolism is quite different (shouldn't there be creatines and phosphocreatines that we see in normal body cells?) than normal cell metabolism.
Too farfetched? Think of the consequences if true! Is it worth pursuing this "theory" any further? In our opinion yes, and we wish other laboratories investigate this possibility.
We are asking the fellow scientists who are involved in similar projects to offer some thoughts or suggestions as to how to interpret the undetectability of creatines in all tumors except gliomas.