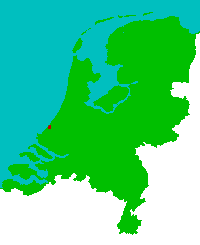
 These are the Netherlands, the way they look like today.
 These are the Netherlands, the way they look like today.
The red dot is where I live, The Hague. It's the residence of our queen, our government, all ministries, most embassies, the peace palace, the Bosnian war crime tribunal and so on. Still the official capital of the Netherlands is Amsterdam. Why? don't ask me.
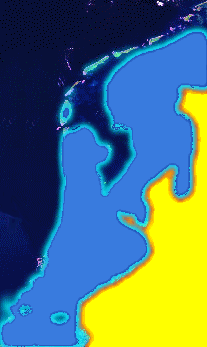
 This satellite picture shows which area's are below sea level, black is sea level, yellow is above sea level, dark
blue is on average 4 meters below sea level. What we call sea
level is NAP, Normaal Amsterdams Peil, a level with relatively
low tide, where it's safe to open up the lock-gates of our
canals. The daily high tide is 1 or 2 meters higher than NAP.
Extreme high tides of 4 meters or more can happen, and will
certainly happen more often if global warming goes on.
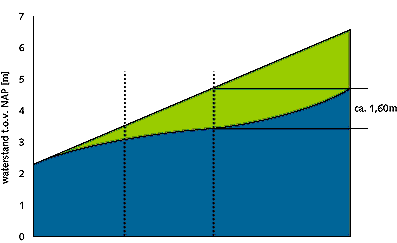
 This graph shows the increasing risks. As I said, 2 meter is normal, 4 meter is about the critical hight
of our dikes. The green side of this graph leads to certain wet
feet... in the red/orange area of the satellite picture above.
The time scale of this graph is logarithmic, the first dotted
line is what we can expect once in 10 years, the second dotted
line is once in 100 years. Blue is without global warming, green
with the expected warming.