Ho: m=mo
HA: m<mo
Test statistic z:

Additional Items
Hypothesis testing was performed for the four variables which influence s for additional analysis calculations as follows.
Test of the Mean with Known Population Variance
The mean of the population for each random variable was tested against the value given in Table 1 in the problem statement. In order to analyze the means, hypothesis testing was used. The procedure followed for each is outlined below:
Ho: m=mo
HA: m<mo
Test statistic z:
Whether the test statistic lies in the region of rejection and if the null hypothesis should be rejected or accepted was determined. The results are listed below in Table 9 below.
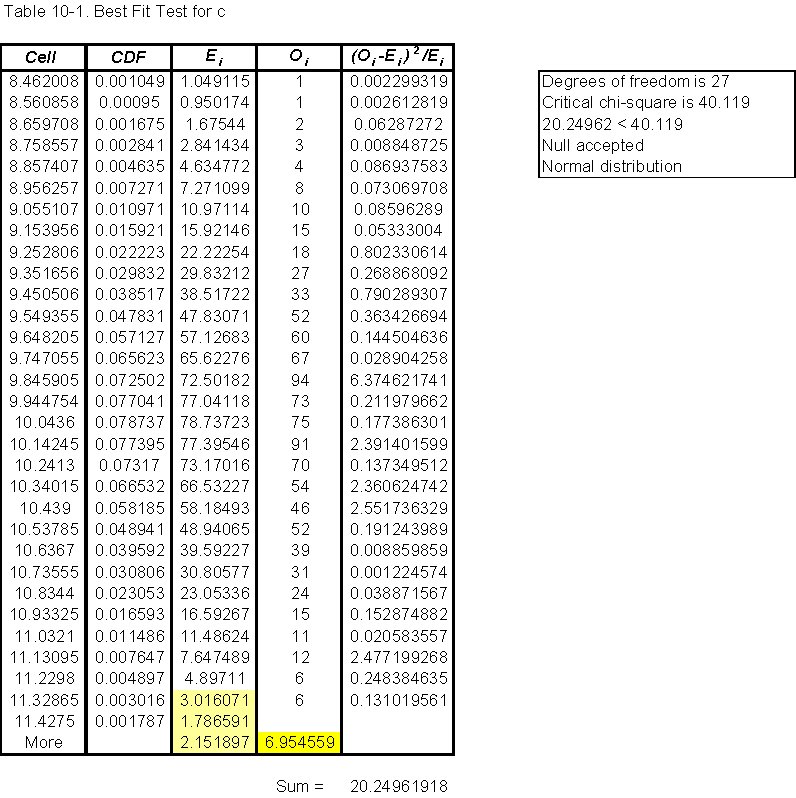
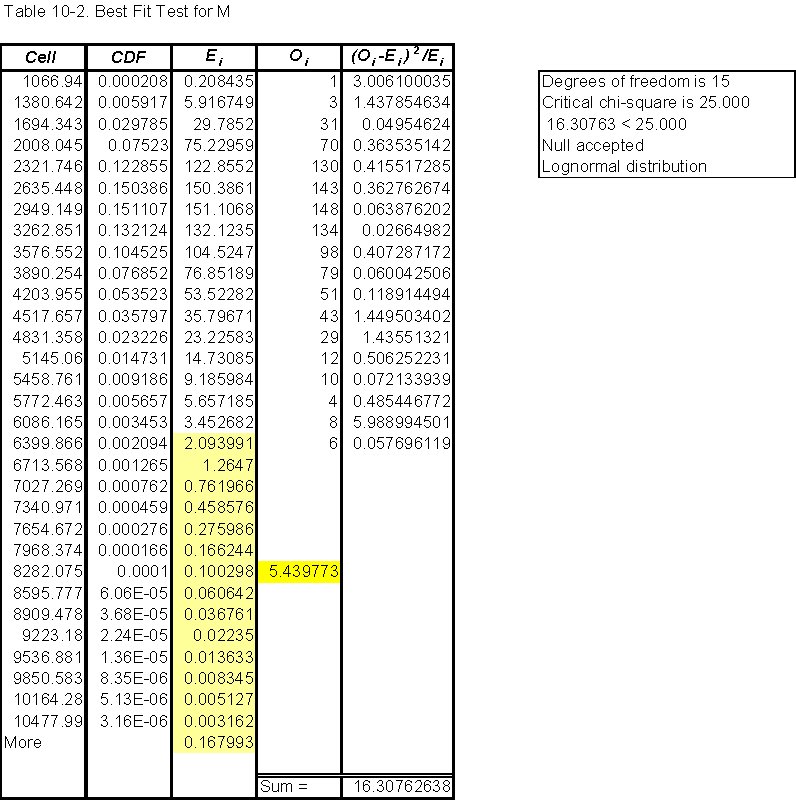
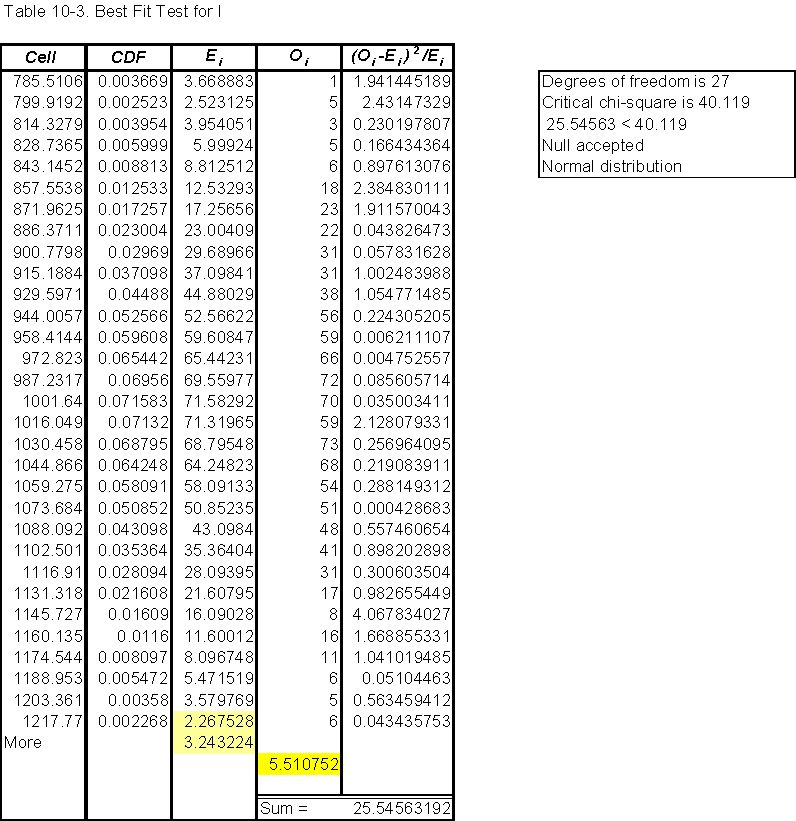
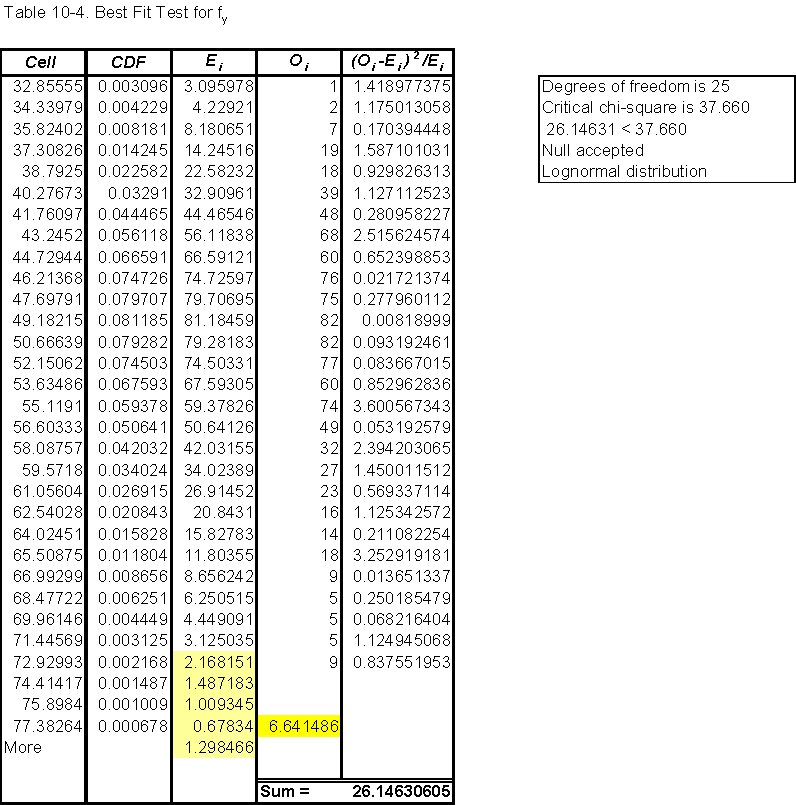
Goodness of fit of Probability Distributions for c, M, I, fy
The probability distributions for the random variables c, M, I, and fy were analyzed to determine whether the random numbers generated followed the given distributions from Table 1 in the problem statement. The chi-square test was performed on each of the random variables using the procedure described for the chi-square test for the goodness of fit of s. The hypotheses used indicated whether the variable followed a normal or lognormal distribution, depending on the given distribution type. The level of significance was kept at 5% and the degrees of freedom equal to the number of histogram bins in each corresponding histogram less k, where k is the degrees of freedom. The results of the chi-square test for goodness of fit of the random variables are listed in Tables 10-1 through 10-4.
Goodness of fit of c (Table 10-1)
Goodness of fit of M (Table 10-2)
Goodness of fit of I (Table 10-3)
Goodness of fit of fy (Table 10-4)