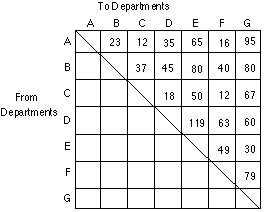
From/to Chart

A chart showing the relationships between a set of points.
For example, the mileage between cities (charts shown on many
road maps); the flow of material between functional areas of
a plant. Rows and columns have identical titles in a corresponding
sequence. Entries in the chart may represent the distance between
centres of departments, number of material handling trips made
between departments in each day, total material movement represented
by weight, cost, quantity etc.
The bottom section has been left blank as it usually mirrors
the data in the top half. If however a one-way system was in
use, then the distance A to B might not be the same as the distance
B to A and in the this case the bottom part of the matrix would
hold the different data. When dealing with trips rather than
distance, it may be found useful to add totals columns at the
right and bottom edges of the matrix.
Reference
- Production Systems; J L Riggs, Wiley, 1987
|