Graphs, Gantt, Histograms and Bar charts
Graphs, whether presentational (i.e. to convey data in some
pictorial manner) or mathematical (i.e. one from which data may
be interpolated or extrapolated), are used to facilitate understanding
and analysis of the collected data, investigate relationships
between factors, attract attention, indicate trends and make
the data memorable. there is a wide choice of graphical methods
available (i.e. line graphs, bar charts, pie charts, Gantt chart,
radar charts, band charts) for different types of application.
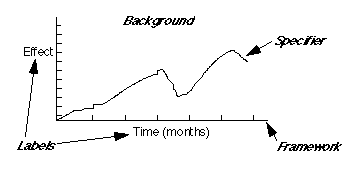
 Line Graph (Generic)
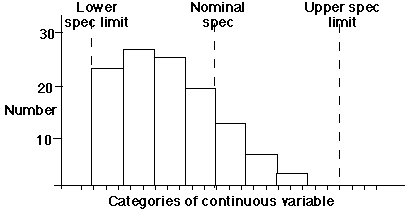
 Histogram (Generic)
The following are the types of issue which need to be considered
in the construction of graphs:
- Use clear titles and indicate when and how the data were
collected (i.e. the theme of the graphs and the source of data).
- Ensure that the scales are clear, understandable and represent
the data accurately.
- When possible, use symbols for extra data.
- Always keep in mind the reason why a graph is being used
(i.e. to highlight some information or data in a striking and
unambiguous way) and anything that facilitates this objective
is desirable.
|