Chapter 4 Earthquakes / Brittle
Faults - Key Points:
1. Distribution
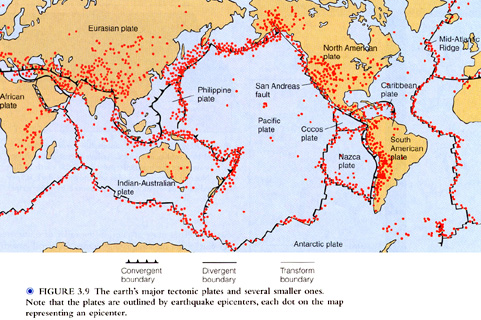
- Global: See Fig. 3.9 (P.57)
Principally, but not exclusively, related to plate boundaries of the 4 overall
types. Also-old fault zones within plates eg. East Ontario / Quebec.
(i)Divergent
eg.
Sea floor spreading ridges; East African Rift Valley System
(ii) Convergent
(a) Subduction zones:
eg.
Major trenches (eg. Chile; Japan)
(b) Collision zones:
eg.
Himalayas; Alpine Mountain System
(iii) Transform (Lateral motion)
eg.
San Andreas (P.111)
North
Anatolian fault, North Turkey
- Earthquakes in Canada
: See overheads
- Lake Ontario/ Toronto Region:
Relevant
to nuclear reactor sites. (See overheads).
Click
here to view a diagram of Earthquake Epicenters
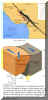
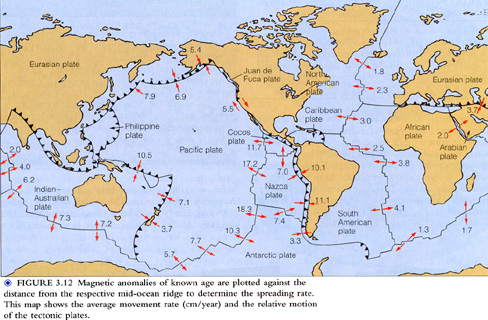
Click
here to view a picture of the relative motions of the tectonic plates
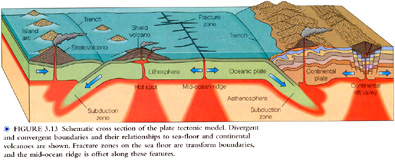
Click
here to view a diagram of the cross section of the plate tectonic model
Click
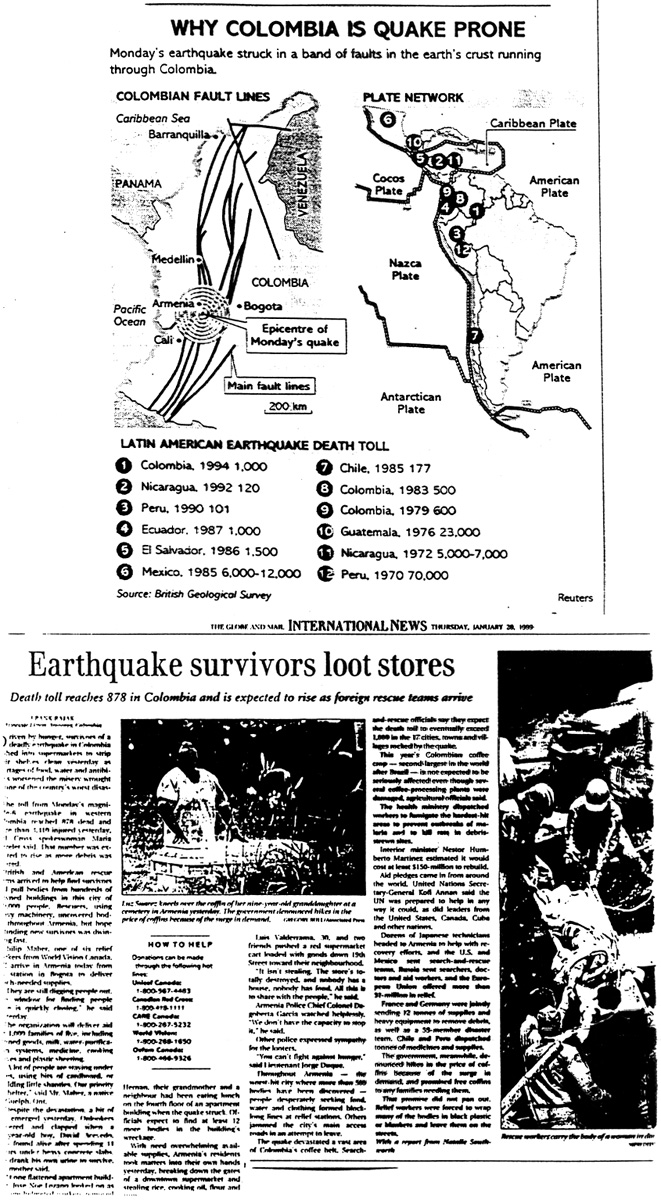
here to view a picture and article on the 1999 Colombia earthquake
Click
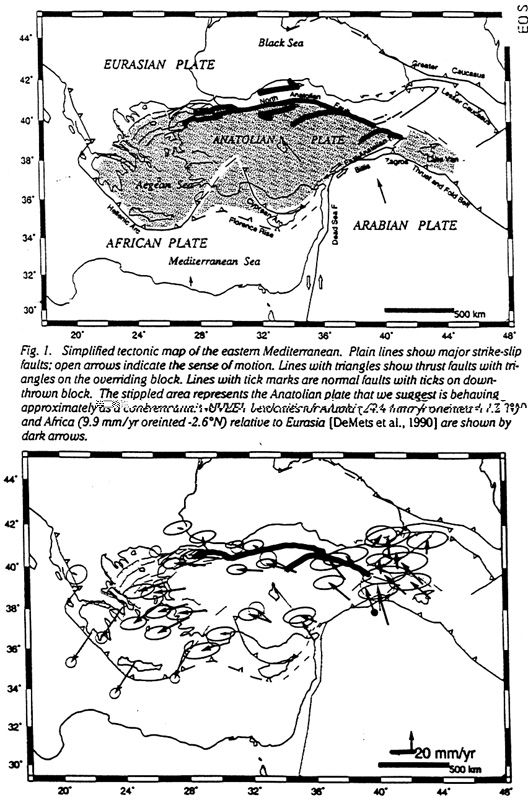
here to view a simplified tectonic map of the eastern Mediterranean
Earthquakes in Canada
- 200-300 earthquakes recorded per year ( see next)
- 10-20 p.a. are sufficiently strong and widely felt to result in public response.
- 8 major earthquakes this century of >R7:
- 5 in the West (2 in the Queen Charlotte Islands> R8)
- 2 in the East
- 1 in the Arctic
- East has ~ 1 earthquake per decade of >R6 (not much more)
- West 2>R6.5
- Arctic 2 >R6.5
Large earthquakes in the East:
- Quebec City, Quebec 1630 >R8
- Cornwall, Ontario 1944 R5.9
- Lake Erie 1986 R5.7
Eastern USA
- New Madrid, IL 1811-12 ~R7.1-7.4
- Charleston, SC 1886 ~R7.5
Click
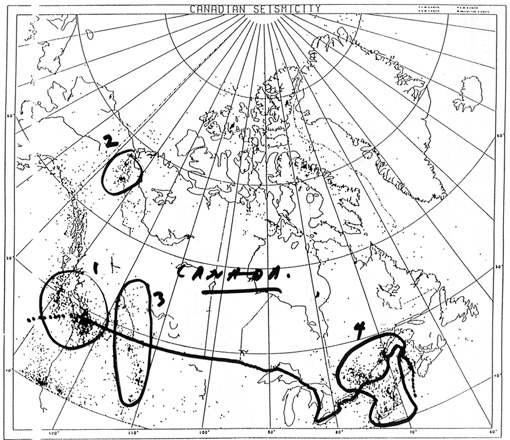
here to view a map of Canadian Seismicity
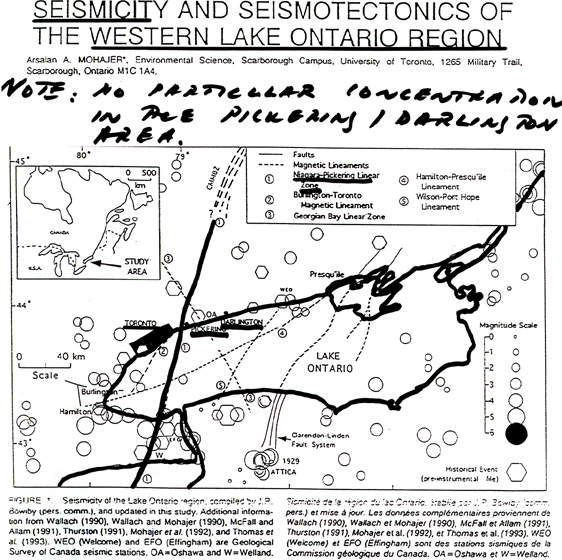
Click
here to view a map of Ontario Seismicity
2. Cause
- Large Scale
:
Principally consequences of plate tectonic extensional, compressional and lateral
movements.
- Specific- Movement on faults
:
Two end-member types of fault movement
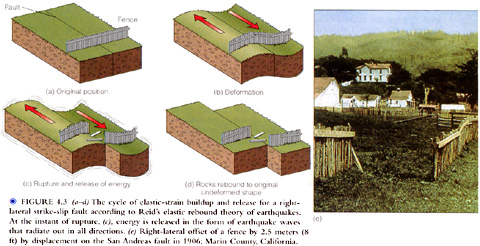
(i) Sudden:
Elastic Rebound Theory
-Frictional resistance on fault plane
-Accumulation of elastic strain
-Sudden release and emission of
ground
shaking waves + internal P and S waves
Eg. P.73
Eg. Loma Prieta 1989 (Magnitude
7.1);
oblique slip: ~2m horizontal + a ~1m vertical.
(ii) Continuous: fault creep
Faults with low frictional resistance permit continuous movement with low
seismicity below a low threshold.
Eg. Hayward Fault( Berkeley)-mm/year
Clearly there is a complete gradation of behaviour between (i) and (ii)To some
extent,
for a given overall average strain rate, the longer the time gap, the larger the earthquake
(the more stored elastic strain energy).

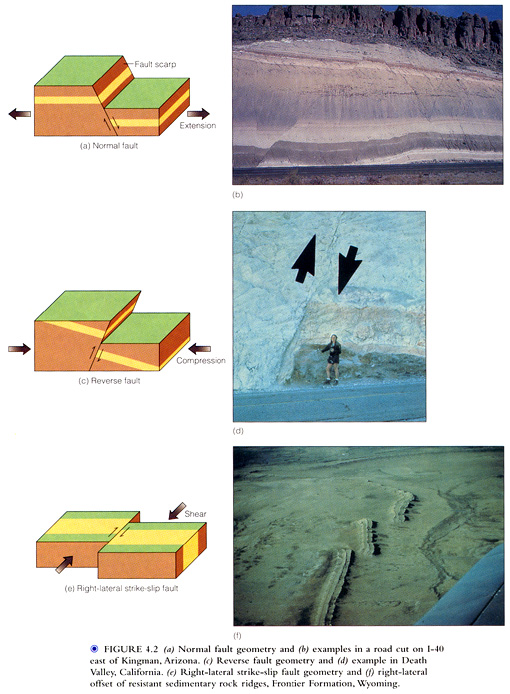
3. Types of faults:
In simplest terms- as given on P.72
- Normal
-extension
- Reverse
-compression
- Strike slip
( right or left lateral)-lateral (horizontal) motion
Click
here to view a picture on different types of fault
4. Earthquake Description:
See P.74
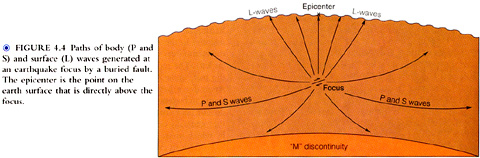
- Exact position within earth = Focus (x/y/z)
- Surface position directly above: Epicentre
Damaging earthquakes- few km from surface
Maximum depth @ 700 km in subduction zones
Eg. Bolivia; June 9,1994: Magnitude 8.3 at a depth of 637km
1.Body Waves (internal):
- P (Primary-arr. first)
: compressional waves
Transmit through liquid; ~10km /s velocity in earth
- ~5km/s in earth
- ~1/2 velocity

2. Surface (L) Waves:
Complex rolling ground motion -> can produce motion sickness if prolonged.
Two end member types: See P.75
- Rayleigh Waves- complex up/down motion reflecting elliptical ground motions.
- Love Waves- side to side motions- the most destructive.
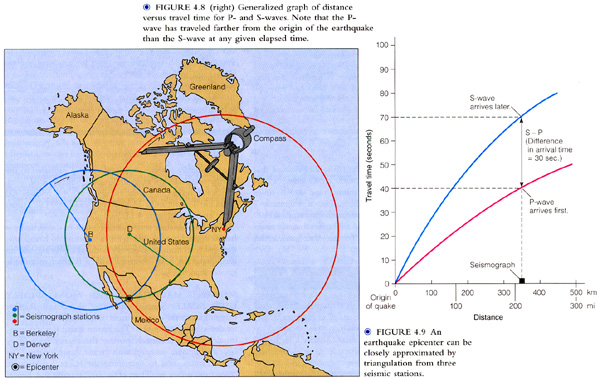
5. Earthquake Location:
Triangulation
See P.77: (1) S-P arrival time difference: f (distance from focus) ->
(2) compute distances and plot; for >=3 seismic stations
Click
here to view a picture on the ground motion during passage of earthquake waves
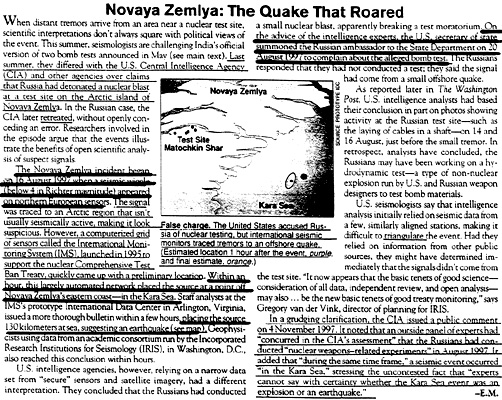
Click
here to view the article "Novaya Zemlya: The quake that roared"
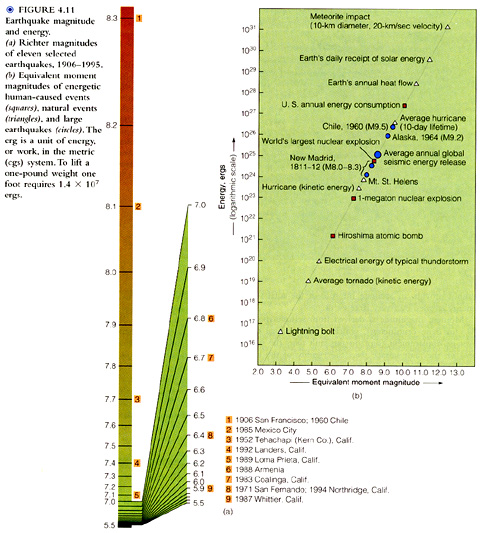
6. Earthquake Magnitude Measurement:
Three Scales:
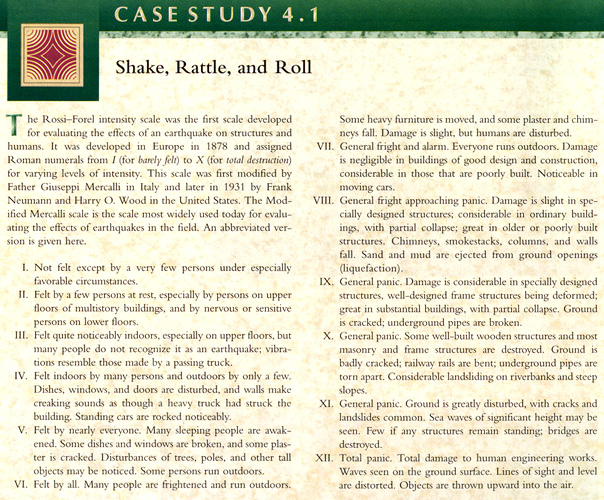
- Modified Mercalli
(P.78):
Effect of earthquakes "in the field": from felt(I) to total
panic(XII).
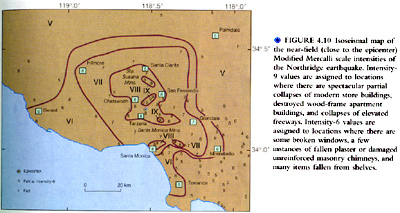
Eg. P.79-Northridge; plot isoseismals

- Richter Scale: a surface intensity scale
(1935)
Logarithmic displacement scale
Hence, Rn= 10*Rn-1
=log10 standard ideal ground motion in microns at a ~100 km distance from
the epicentre (+corrections) e.g. Mag.4= ~1 cm
Highest recent Richter Scale Earthquake: Alaska 1964 at 8.4 �
105*Hiroshima in energy. Since derived from ground motion( displacement):
a function of
depth, not just total magnitude.

- Moment Magnitude (M)
:
Richter is good for surface magnitude description; but not appropriate for total energy released:
Mo*Slip*Rupture Area*Rigidity of faulted rock
Then:
Seismic energy(ERGS) is proportional to Mo
M1 or Mw1=2/3Log Mo-10.7
Largest measured=Chile 1960; M=9.5 (See P.80)
Earthquake |
Richter
Magnitude |
Moment Magnitude |
| Chile,1960 |
8.3 |
9.5 |
| Alaska, 1964 |
8.4 |
9.2 |
| New Madrid, 1812 |
8.7 (est.) |
8.1 |
| Mexico City, 1985 |
8.1 |
8.1 |
| San Francisco, 1906 |
8.3 (est.) |
7.7 |
| Loma Prieta, 1989 |
7.1 |
7.0 |
| San Fernando, 1971 |
6.4 |
6.7 |
| Northridge, 1994 |
6.4 |
6.7 |
| Kobe, Japan, 1995 |
7.2 JMA |
6.9 |
Click here to view a chart on earthquake magnitude and
energy
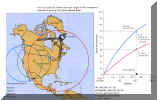
Earthquake Prediction; Key points: (P.109-112)
O.K. in a very general sense; but very difficult in a specific sense in terms
of specific location and time; also magnitude.
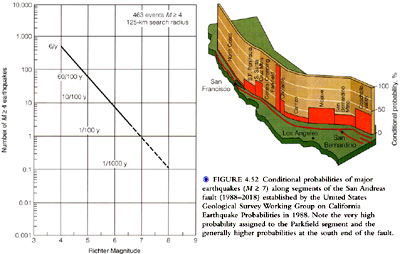
3 approaches:
- Statistical
From analyzing past data for a given area, can derive statistical frequencies /
probabilities: very useful for building codes
Eg. Fig.4.51. Mag.8(Richter): 1 per 1,000 years
Also: Fig. 4.52
N.B. Worldwide: expect an average of 2 Mag.8 earthquakes per year.
I hadn’t realized it was so high.
N.B. Can extend record back in past by, for example, 14C dating of disrupted marsh horizons.

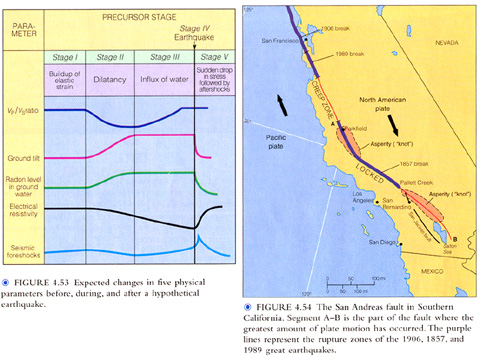
2. Geophysical:
Some geophysical parameters which can be measured can change in advance of earthquakes
partly as a consequence of:
Dilatancy:
i.e. with inc. stress microcracks open; and become fluid filled
eg. fig 4.5.3
eg P wave velocity goes down, relative to S wave velocity by ~10%;
Therefore Vp/Vs can go down in advance
Also: radon release; electrical resistively change; ground tilt.
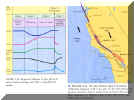
3. Geological:
Eg.Asperity/locking model of earthquake segments:
- Major locking("asperity")zones:
Strain build-up: infrequent, but large earthquakes.
- Less significant locking:
More frequent; smaller shocks
- Creep zones:
Low magnitude earthquakes and microearthquakes
Eg. Fig.4.54
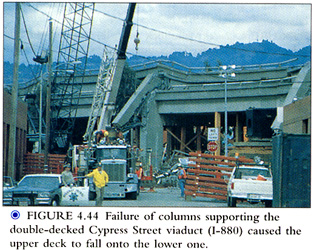
7. Principal Natural Effects(P.81-92):
- Ground Shaking
:
Esp. side to side Love waves
Structural damage; Fire-broken gas mains
Eg. Expressway viaducts, buildings, etc.
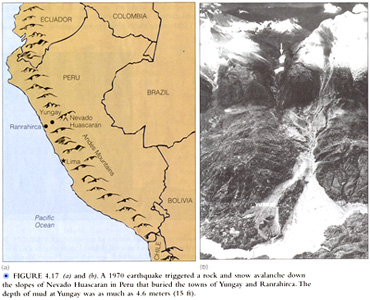
- Landslides
:
Eg. ~17,000 produced by Northridge
- Liquefaction
: Damage eg. Alaska (P.86)
- Ground rupture/elevation changes
:
Produce:
--> Fault shapes
--> Flooding/ Exposure e.g. 11m - Alaska 1964
5. Tsunamis("Tidal
waves"):
Eg. Hokusai’s famous great wave (one of the 36 views of Mount Fuji)
6. Conquences:
Various; all negative
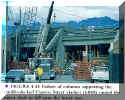
Therefore, high quality engineering design and construction are
critical. eg. P.112

Click
here to view pictures of the effect of an earthquake in Japan; 1964
Click
here to view some pictures on the effect of earthquakes in Colorado and Alaska
Click
here to view pictures on the evolution of a tsunami
| 


